Progress Insights B2B

  • COMPANY

  • Preply Business

  • Role

  • Designer

  • Type

  • New Feature

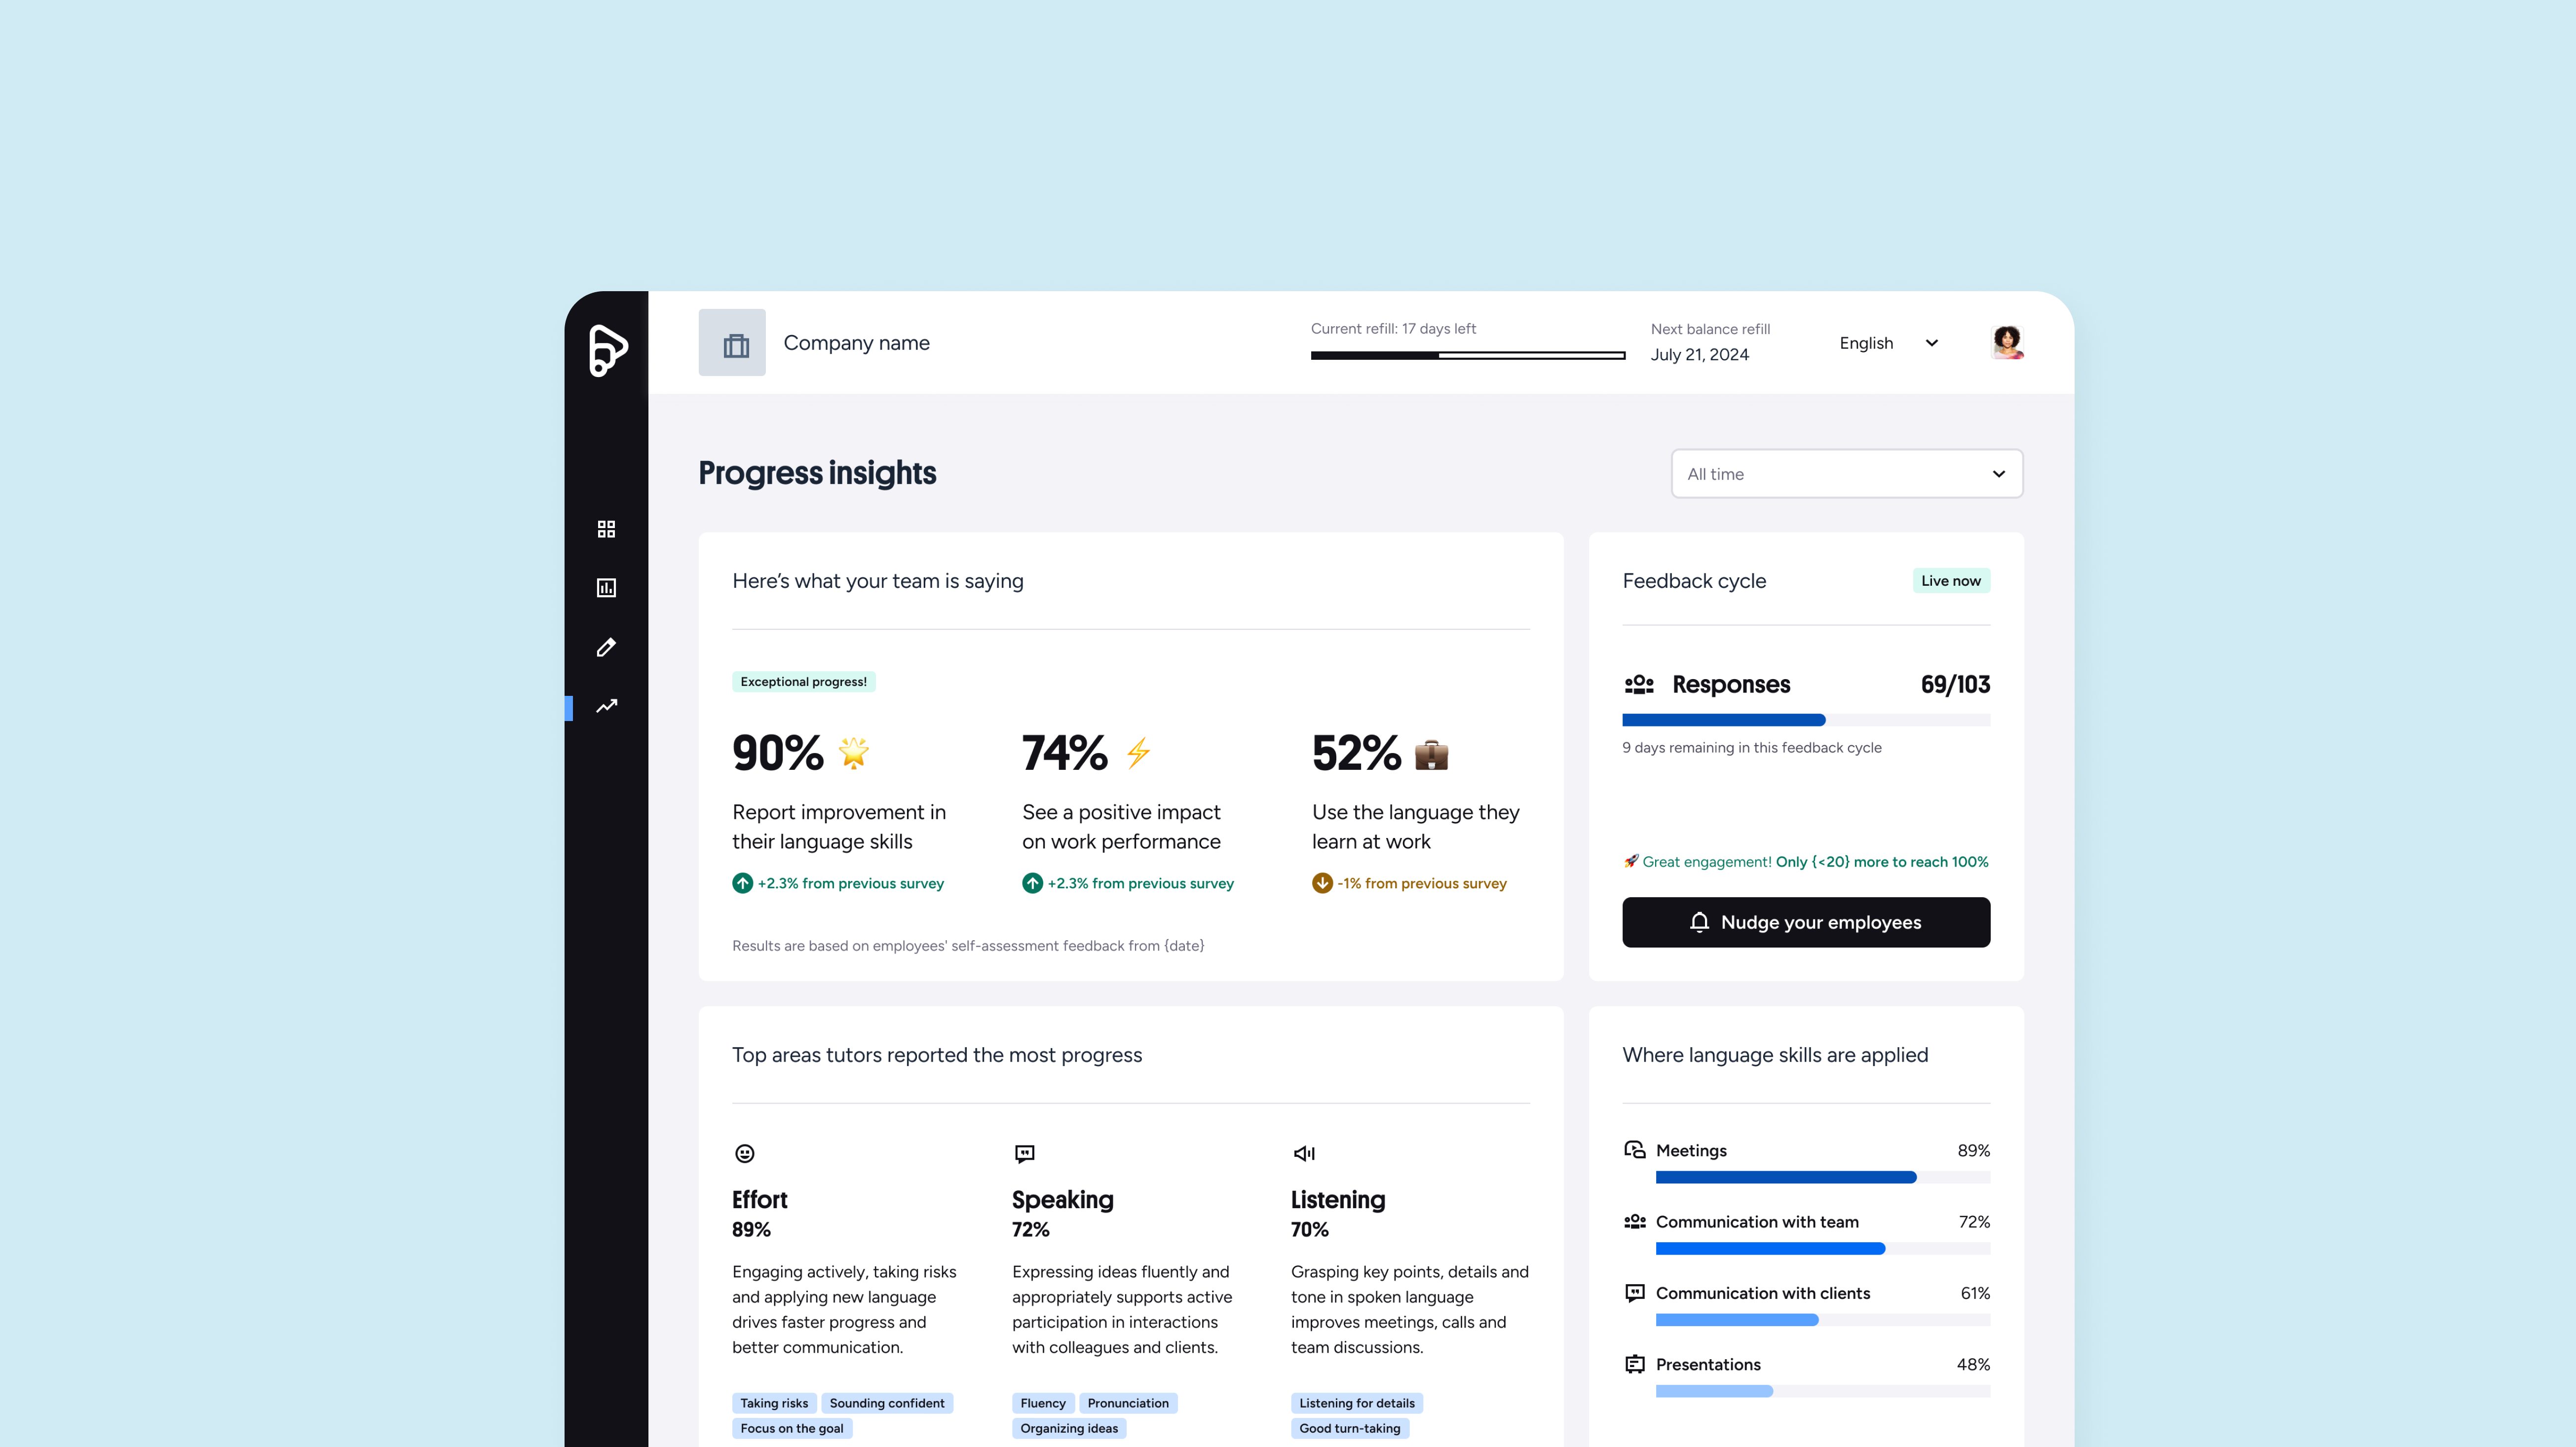
Preply is a global learning platform that connects learners with tutors for 1on1 lessons. We collaborate across teams to design engaging learning experiences, empower tutors, and help learners achieve their goals through tailored, human-driven experience. Progress Insights was a project designed to help Preply Business clients better understand the impact of their company’s language learning program. These adminst manage how employees use Preply as an employee benefit and need clear visibility into how the program is performing.
Overview


Before this project, progress reporting was handled manually by key account managers. They collected survey results from learners and tutors, summarized the data, and built custom reports, usually as PDFs or presentations. This process was time-consuming, inconsistent across clients, and difficult to scale.

With Progress Insights, our goal was to bring this experience into the Preply admin dashboard, creating a structured, data-driven, and accessible way for clients to understand their team’s language progress.


My Role


As the Product Designer, I led the research, mapping, and design of the experience from start to finish. I began by reviewing past manual reports and interviewing key account managers to understand how they shared results and what information mattered most.

I also analyzed the existing surveys for learners and tutors to identify which questions actually reflected progress. This helped define which data points were useful, what to exclude, and how to visualize them clearly.

wireframes-b2b


The Challenge


Before this project, progress reports were created manually by key account managers, who collected survey data from learners and tutors, summarized it, and built custom reports for each client. The process was time-consuming, inconsistent, and hard to scale.


Parts of the process


From the very beginning, one key question guided my approach: How might we create this report in a way that tells a positive story?

 We were very cautious about relying only on survey data, knowing it could expose negative responses if not framed thoughtfully. This question shaped every design decision that followed.

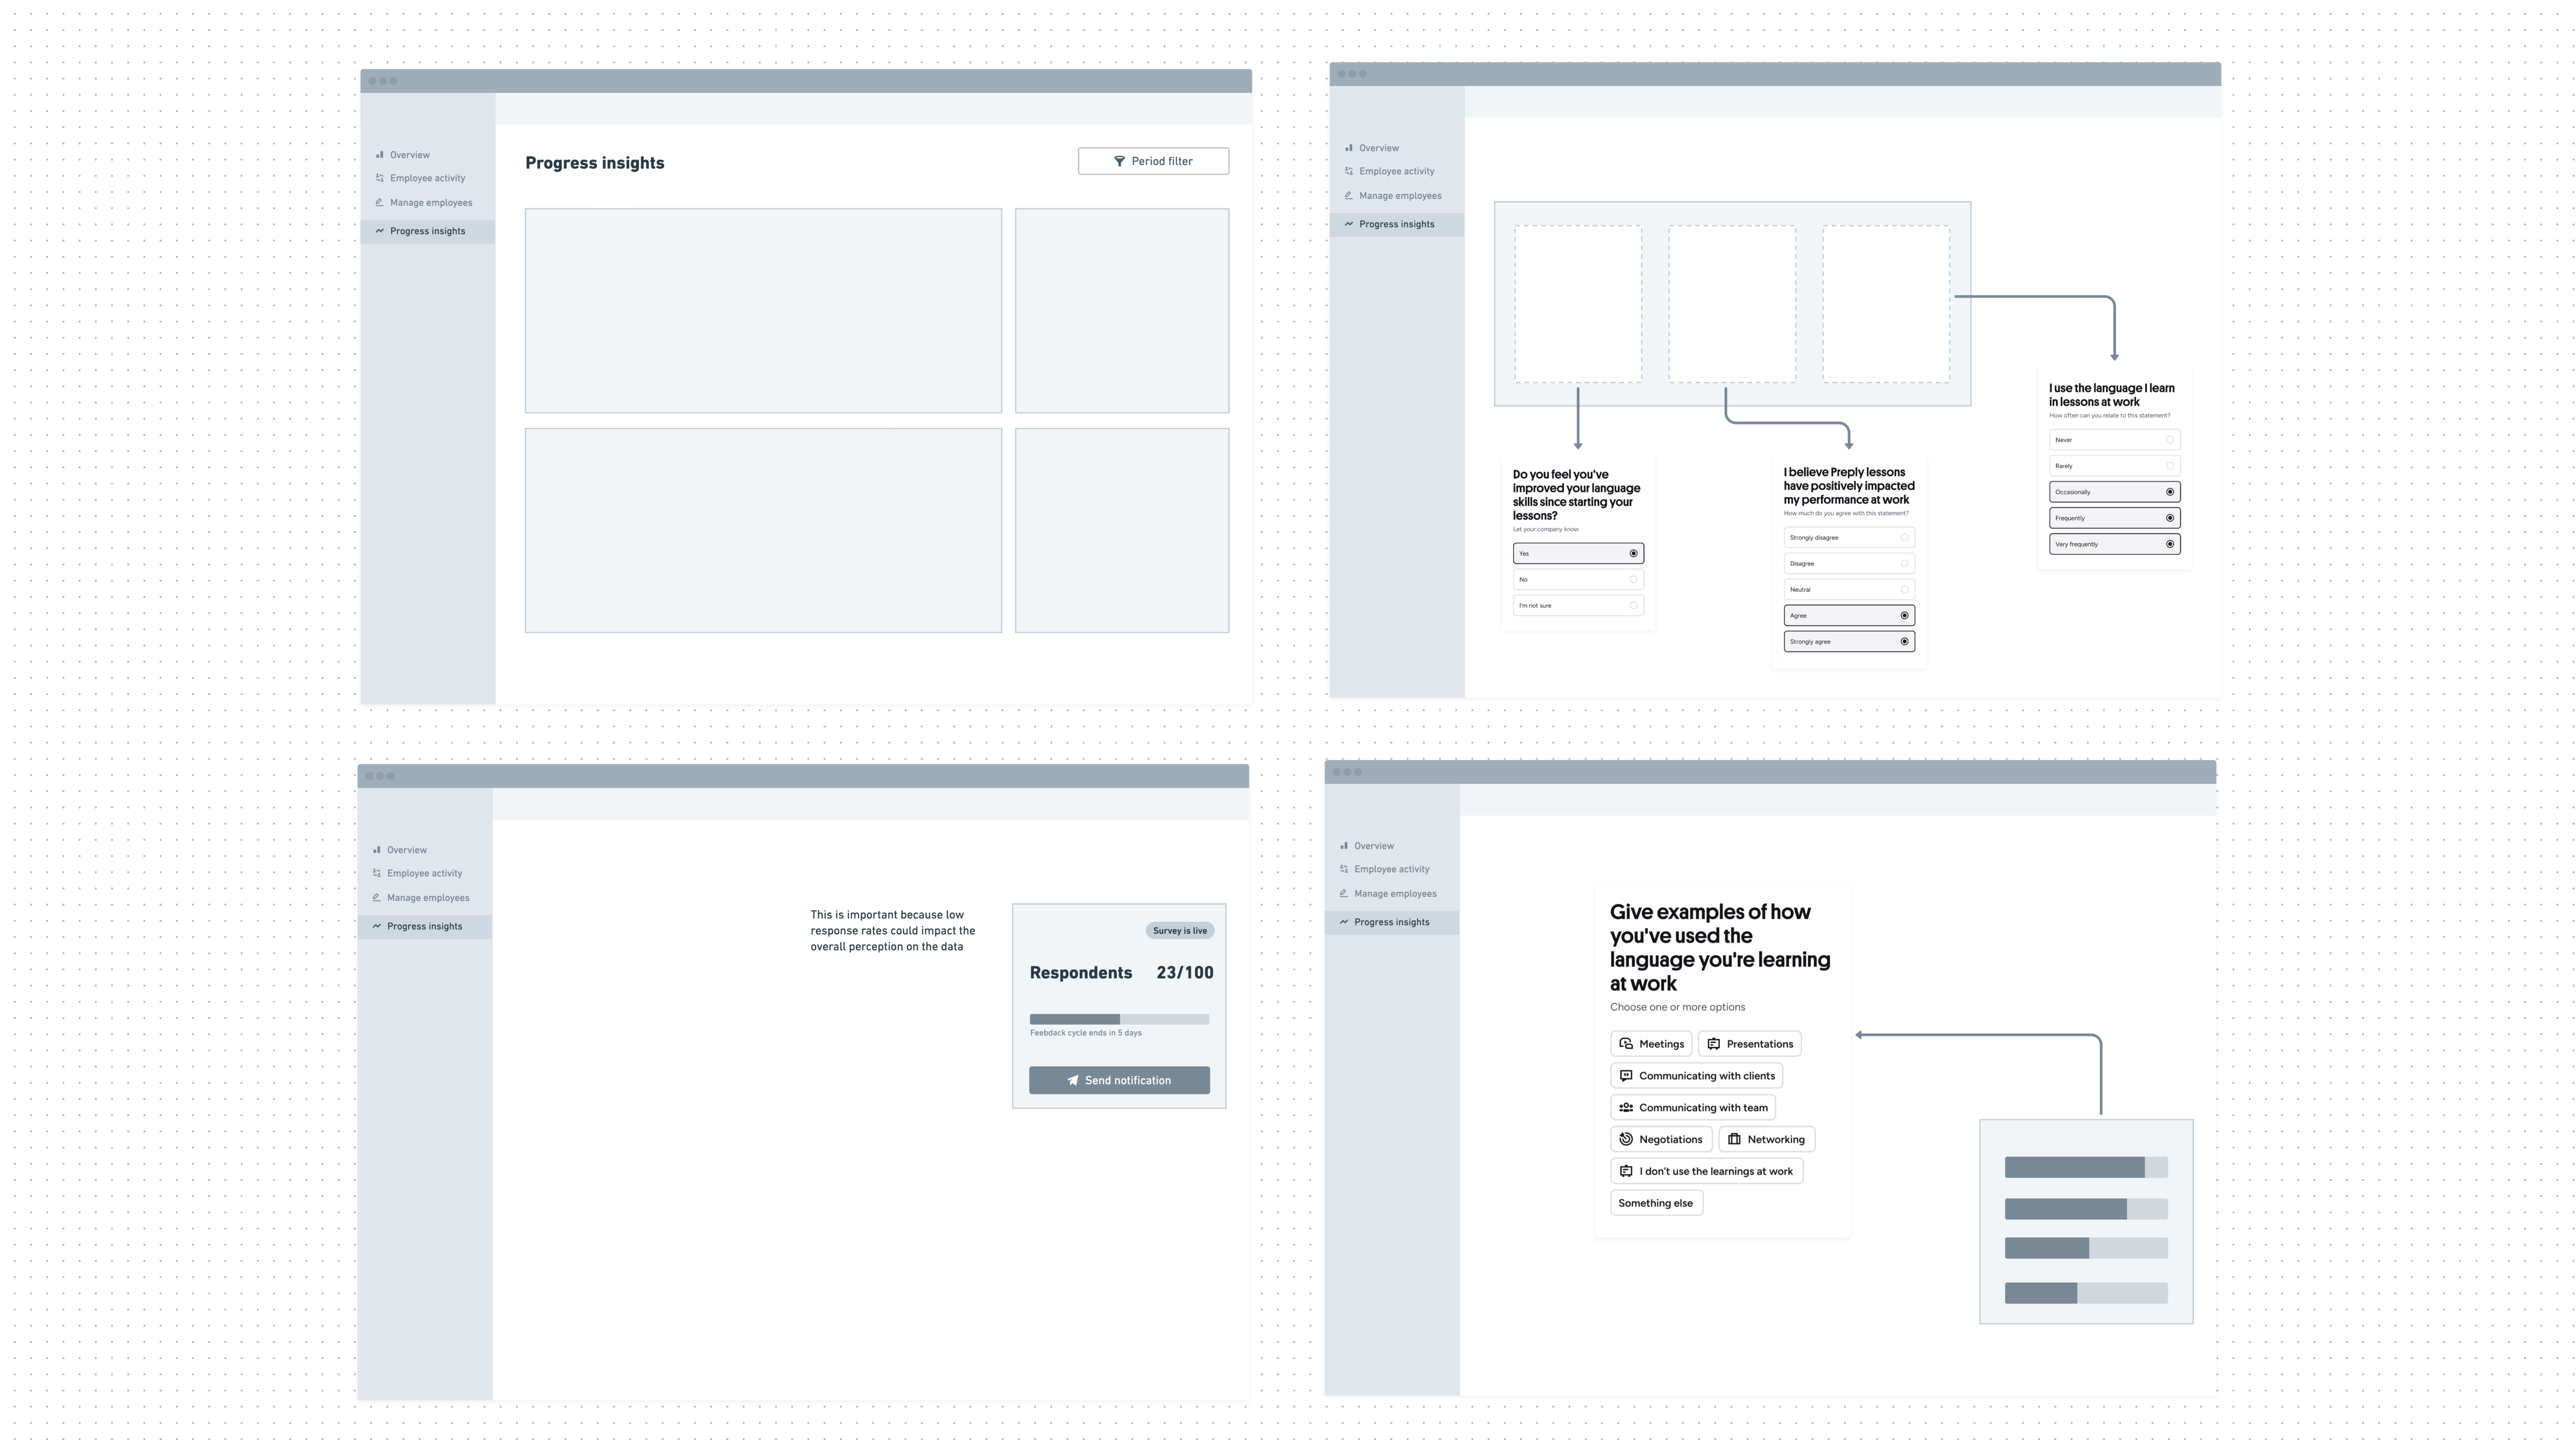
After mapping the data and filtering what truly represented learning progress, I started creating early wireframes to explore different visualization approaches. I worked closely with stakeholders and key account managers to align on what data points were safe to show, what required more context, and what could drive positive actions.

We then ran a validation round with six POCs, showing them the early wireframes and discussing how they interpreted the data. The testing helped us understand which metrics they found most useful and how they reacted to potential negative data points.

One example that stood out was a data point showing that 70% of employees said they did not have enough time to learn. We initially thought this would be seen as a negative result, but clients interpreted it differently. They saw it as an opportunity to take action, helping their teams prioritize time for lessons. This insight gave us confidence to include similar data points, as long as the framing focused on action and improvement.

We also learned that not all POCs had the same priorities. Some cared deeply about learning progress, while others were more focused on utilization. Since utilization was already covered in other parts of the dashboard, we decided to keep this project focused purely on progress and impact.


The outcome


The Progress Insights feature is now live and performing successfully. About 35% of all admins access the Progress Insights tab daily, showing strong adoption and engagement.
The project not only simplified the reporting process for clients but also changed how we communicate learning outcomes at Preply. It moved the experience from manual reports to an integrated, data-driven dashboard, giving clients direct access to meaningful insights in real time.


This feature also opened the door for future opportunities. Since launch, it has created a foundation for expanding our data strategy within the admin space. We are now exploring ways to include insights from actual lessons, allowing POCs to stay continuously informed about learner activity and progress beyond survey data.


The success of this project proved that data transparency, when designed thoughtfully, can build trust and drive engagement, both internally and with clients. It also validated that design decisions grounded in empathy and positive storytelling can have a direct business impact, improving renewal conversations and client satisfaction.

  • hero0unified
  • Project 01

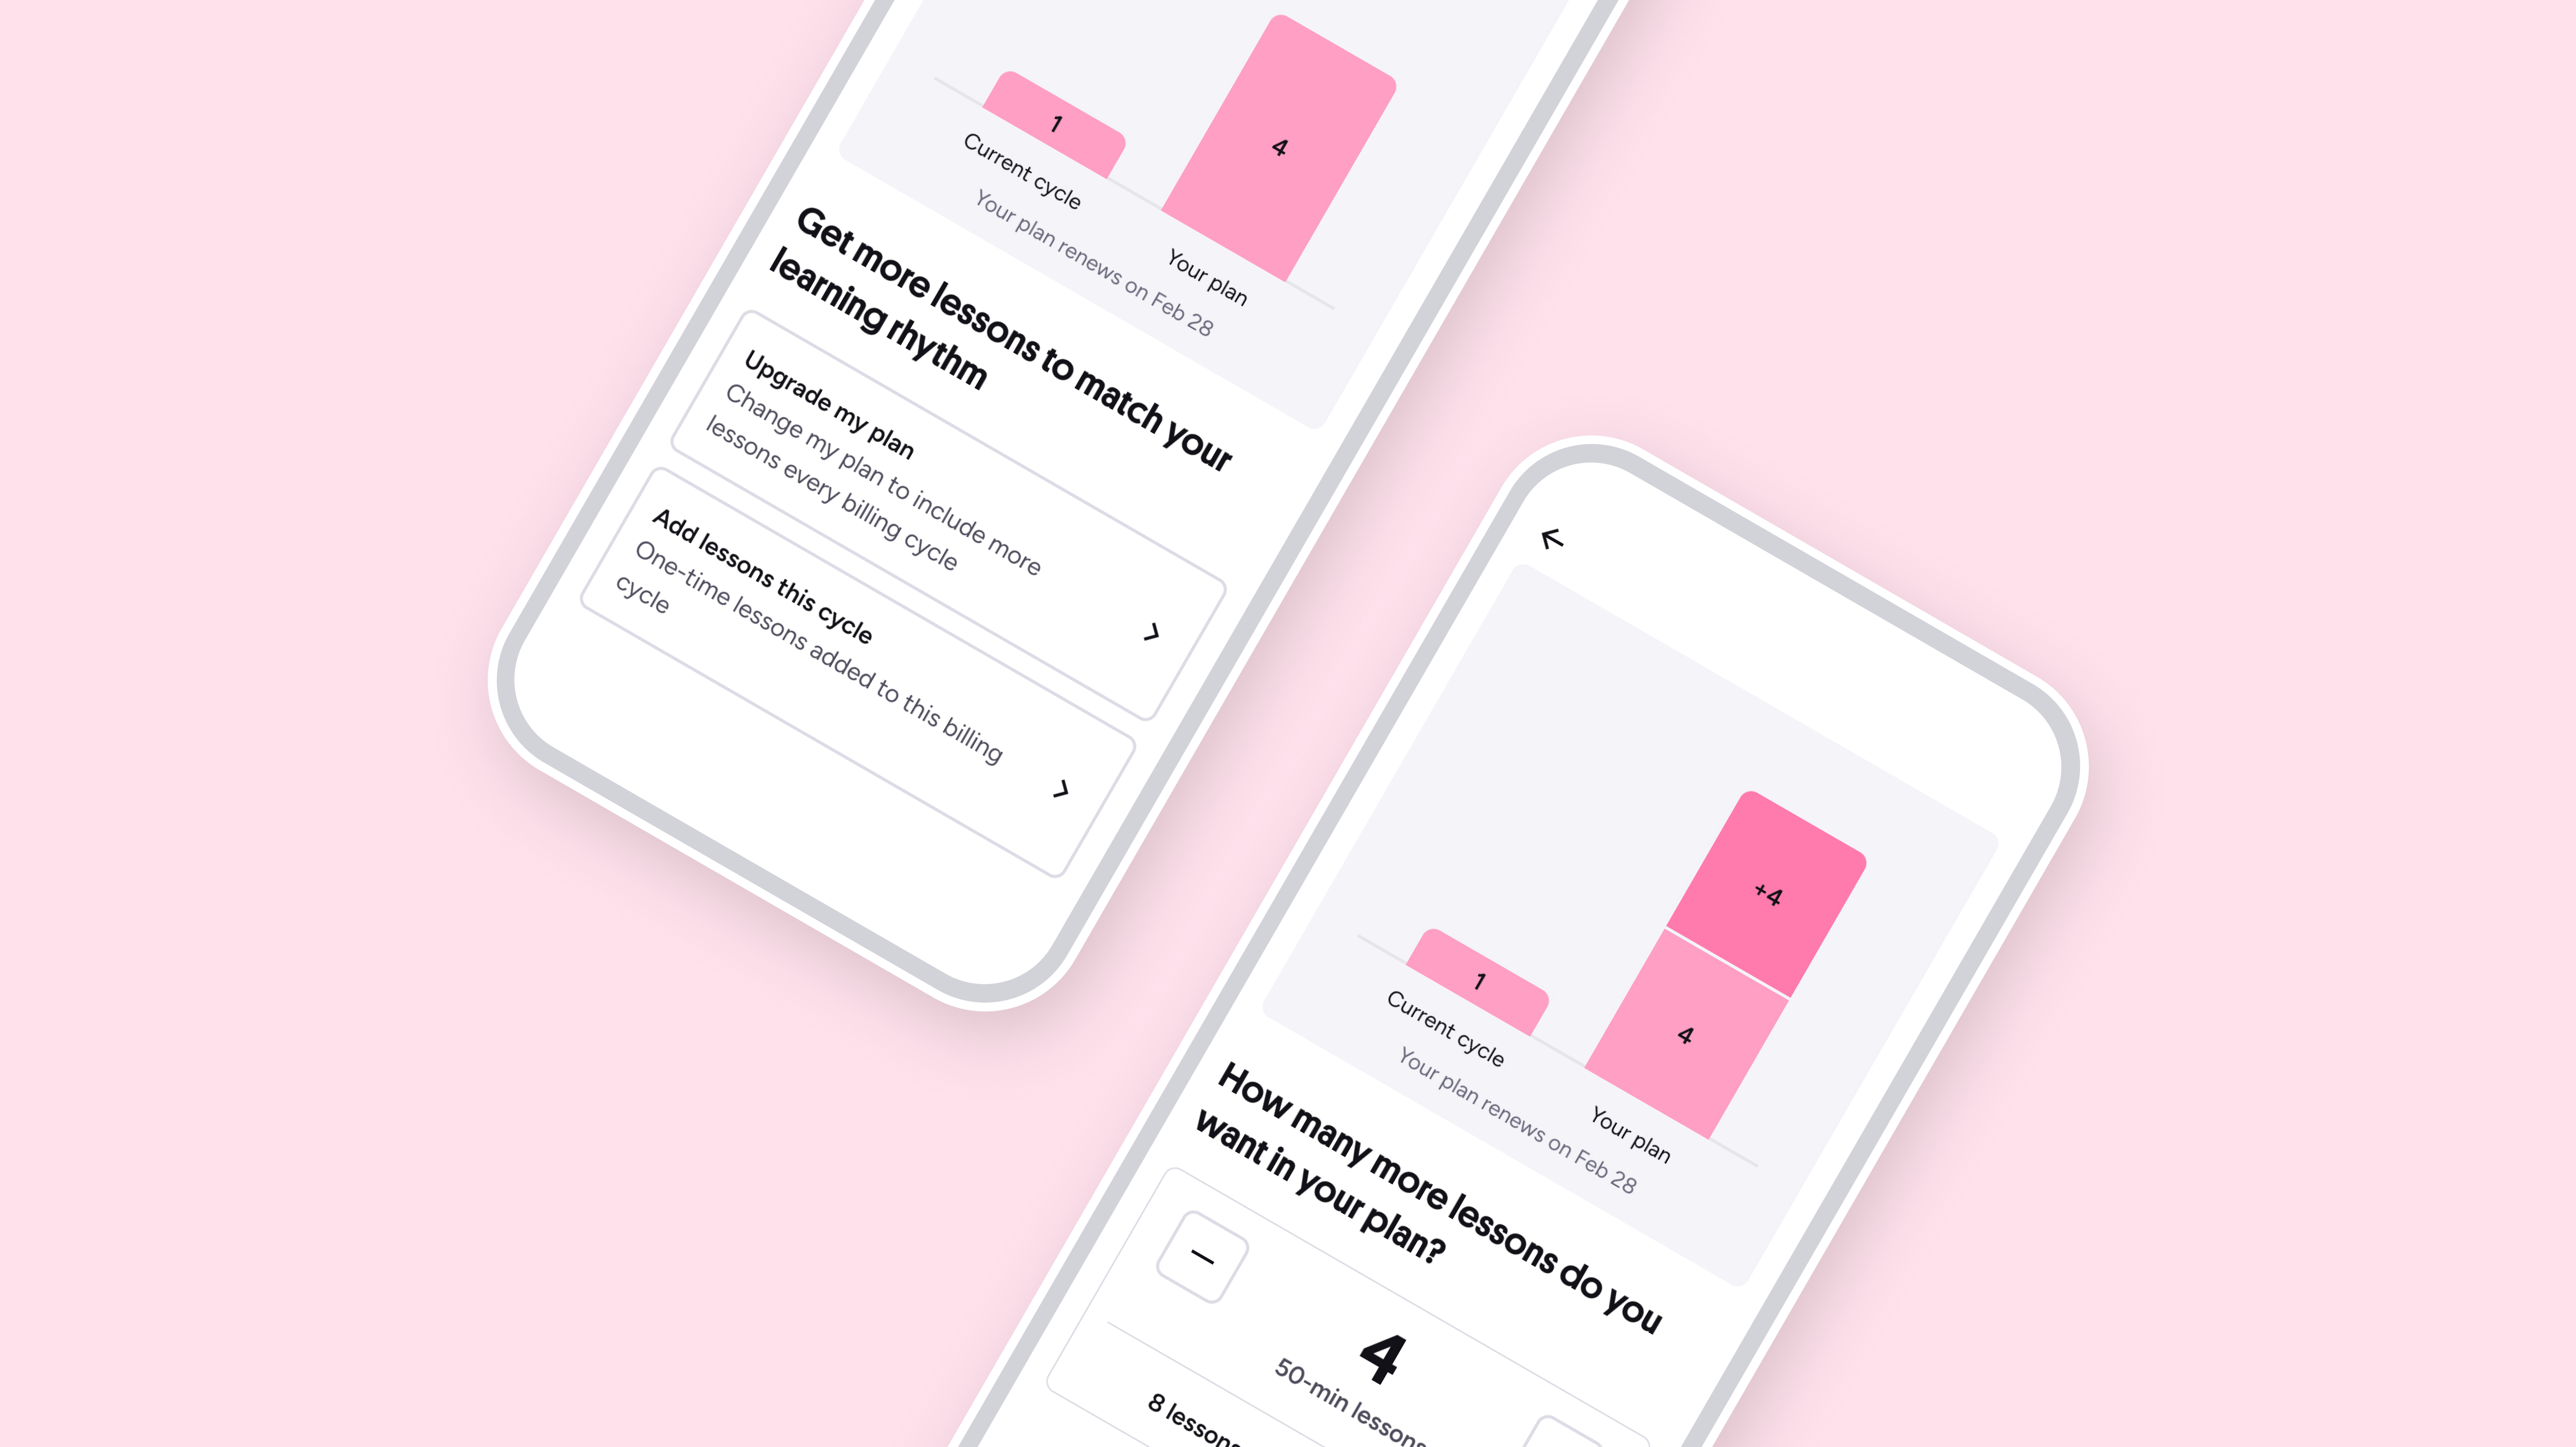
    Unified Add Lesson

  • hero-ai-message
  • Project 02

    AI First Message Flow

  • australia-mvp hero
  • Project 03

    Australia MVP

Let’s work together

© 2026

Home

Work

About

Jenni Ribeiro

Back to projects

Progress Insights B2B

  • COMPANY

  • Preply Business

  • Role

  • Designer

  • Type

  • New Feature

Preply is a global learning platform that connects learners with tutors for 1on1 lessons. We collaborate across teams to design engaging learning experiences, empower tutors, and help learners achieve their goals through tailored, human-driven experience. Progress Insights was a project designed to help Preply Business clients better understand the impact of their company’s language learning program. These adminst manage how employees use Preply as an employee benefit and need clear visibility into how the program is performing.

Overview


Before this project, progress reporting was handled manually by key account managers. They collected survey results from learners and tutors, summarized the data, and built custom reports, usually as PDFs or presentations. This process was time-consuming, inconsistent across clients, and difficult to scale.

With Progress Insights, our goal was to bring this experience into the Preply admin dashboard, creating a structured, data-driven, and accessible way for clients to understand their team’s language progress.


My Role


As the Product Designer, I led the research, mapping, and design of the experience from start to finish. I began by reviewing past manual reports and interviewing key account managers to understand how they shared results and what information mattered most.

I also analyzed the existing surveys for learners and tutors to identify which questions actually reflected progress. This helped define which data points were useful, what to exclude, and how to visualize them clearly.


wireframes-b2b


The Challenge


Before this project, progress reports were created manually by key account managers, who collected survey data from learners and tutors, summarized it, and built custom reports for each client. The process was time-consuming, inconsistent, and hard to scale.


Parts of the process


From the very beginning, one key question guided my approach: How might we create this report in a way that tells a positive story?

 We were very cautious about relying only on survey data, knowing it could expose negative responses if not framed thoughtfully. This question shaped every design decision that followed.

After mapping the data and filtering what truly represented learning progress, I started creating early wireframes to explore different visualization approaches. I worked closely with stakeholders and key account managers to align on what data points were safe to show, what required more context, and what could drive positive actions.

We then ran a validation round with six POCs, showing them the early wireframes and discussing how they interpreted the data. The testing helped us understand which metrics they found most useful and how they reacted to potential negative data points.

One example that stood out was a data point showing that 70% of employees said they did not have enough time to learn. We initially thought this would be seen as a negative result, but clients interpreted it differently. They saw it as an opportunity to take action, helping their teams prioritize time for lessons. This insight gave us confidence to include similar data points, as long as the framing focused on action and improvement.

We also learned that not all POCs had the same priorities. Some cared deeply about learning progress, while others were more focused on utilization. Since utilization was already covered in other parts of the dashboard, we decided to keep this project focused purely on progress and impact.


The outcome


The Progress Insights feature is now live and performing successfully. About 35% of all admins access the Progress Insights tab daily, showing strong adoption and engagement.
The project not only simplified the reporting process for clients but also changed how we communicate learning outcomes at Preply. It moved the experience from manual reports to an integrated, data-driven dashboard, giving clients direct access to meaningful insights in real time.


This feature also opened the door for future opportunities. Since launch, it has created a foundation for expanding our data strategy within the admin space. We are now exploring ways to include insights from actual lessons, allowing POCs to stay continuously informed about learner activity and progress beyond survey data.


The success of this project proved that data transparency, when designed thoughtfully, can build trust and drive engagement, both internally and with clients. It also validated that design decisions grounded in empathy and positive storytelling can have a direct business impact, improving renewal conversations and client satisfaction.


  • hero0unified
  • Project 01

    Unified Add Lesson

  • hero-ai-message
  • Project 02

    AI First Message Flow

  • australia-mvp hero
  • Project 03

    Australia MVP

Let’s work together